Balance Analysis of Plant Tissue

This growing season we added the balance interpretation to our tissue test for corn, soybeans and wheat.

Sufficiency Ranges determine the amount of an nutrient  – Compares your N to the normal range of N

DRIS N vs N

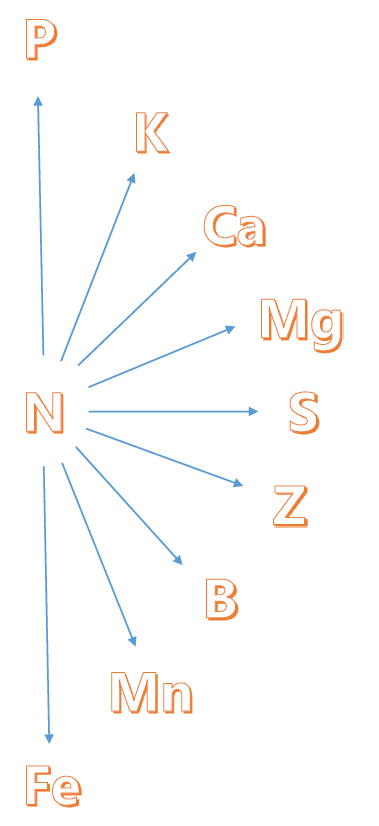
Balance Interpretation determines the balance of a nutrient in the plant tissue  – Compares N  to the normal range of N:P, N:K to N:K, N:S to N:S, etc.

DRIS N vs Others

Both the amount and the balance within the plant tissue are important to interpret your results.

Traditional sufficiency range interpretation compares a nutrient amount to an established normal range (Example: N to a normal range for N).  Sufficiency ranges provide insight into the plant but in some cases interpretation can be tricky because the normal range will vary in the growing season, by soil type, hybrid, etc.

Balance interpretation compares nutrient ratios to the other nutrients in the plant (N to P,K,S, Mg, Ca,Zn,Fe,Mn,B). In a typical balance calculation 55 ratios are used to determine the balance.  Using a dataset of known ratios we rank the severity of the imbalance (NBI) and determine which nutrient is out of balance

So see some examples of the balance interpretation on a report go to the Example Plant Tissue Reports page

Soil Sampling Promotion

Soil Sampling Season is Here! Dont Guess Test!


IMAG3550

This harvest season we are offering a 15% discount on geo referenced soil sampling. This includes the custom sampling but not the cost of the soil test.

Custom Soil Sampling:$75/Hour Now $63.75/Hour

Other Information:

-Our report provides a visual interpretation so you can easily visualize the most limiting factor in your soil. See it Here.

-We provide practical tips to maximize your  fertility program based on your soil report.

-You receive a map of where samples were taken with your report.

-Ride along to make sure the field is sampled to your satisfaction.

-Using a soil autosampler gives you speed and consistency of depth. You get the perfect sample every time.

-Geo-referenced samples allow you to get more repeatable consistent analysis for comparison in the years to come.

IMAG3553 (2)


Farmbolus: The latest tool for ruminant nutrition

Logo


The farmBolus is  rumen monitoring system designed for commercial Dairy herds that records pH (acidity levels) and temperature within a Cow.

Bolus and Phone


Data gathered by the eCow farmBolus allows farmers, vets and nutritionists to achieve optimum ruminal conditions which in turn leads to increased yields and healthier cows. eCow is the market leader in the rumen pH bolus field for lifetime and accuracy of results. 

Reticulum

The bolus can be used to:

• Avoid onset of acidosis through early warning
• Keep high yielders performing and identify any
potential for more litres through diet
• Help identify management issues which may lock
up yield potential through irregular routine
• Justify the use and cost of rumen buffers and yeasts
• Monitor cows through calving and the transition from
dry cow to milking cow ration
• Monitor problem groups
• Illustrate the suitability of feeds
Below is a graph of an example pH reading using the
bolus. The green area is classed as the safe zone with
regards to acidosis/SARA and the red zone represents
the 5.8 pH line which we class as the acidosis risk zone.
Cattle are not immediately at risk of acidosis when they
drop below the line and it is dependent on the amount of
time spent in the risk zone. Cows that spend >5 hours/
day under the red line are at a significantly higher risk of
SARA/ acidosis.

Acidosis Graph