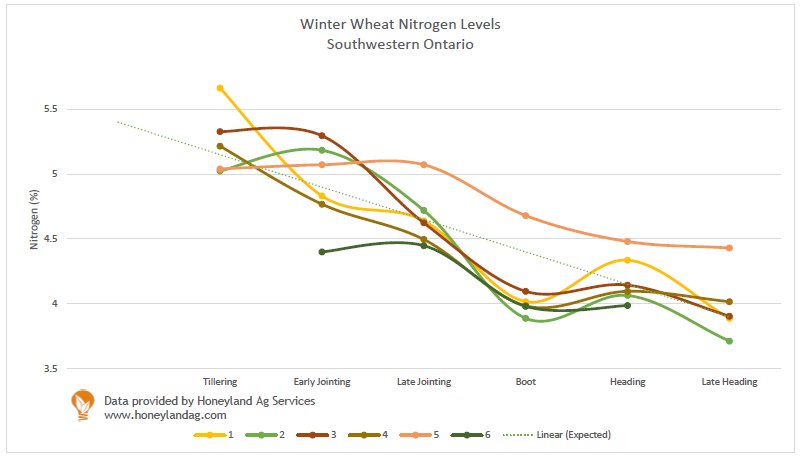
This chart will be updated throughout the growing season as samples are collected. To learn more about the nitrogen levels in wheat please visit: https://www.honeylandag.com/?p=634&preview=true
Powerful Insights for Agriculture
This chart will be updated throughout the growing season as samples are collected. To learn more about the nitrogen levels in wheat please visit: https://www.honeylandag.com/?p=634&preview=true
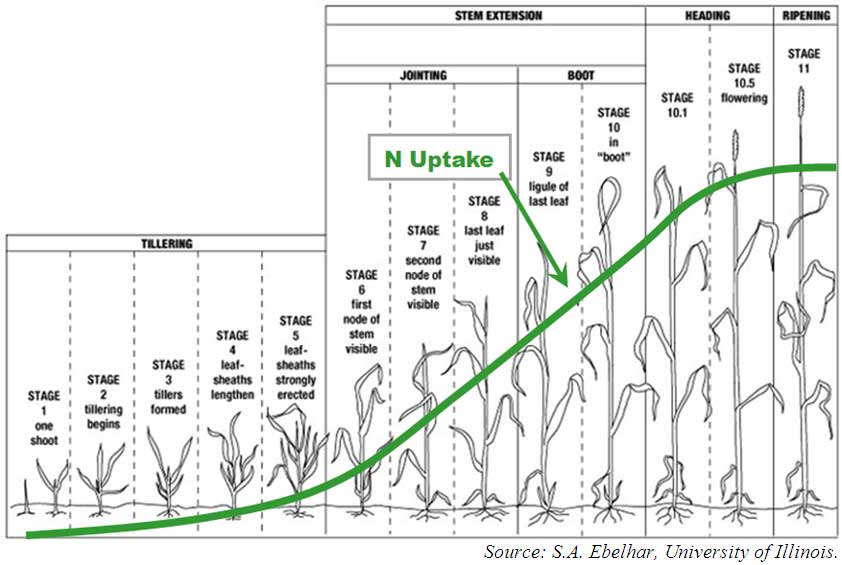
Maintaining adequate nitrogen levels in cereals is critical to maximize yield. Heads begin to develop early in the plant’s life cycle at GS 30 (stem elongation). Inadequate available N causes tiller abortion with resulting lowered harvest population. During the grain fill period uptake of nitrogen from the soil is significantly less than during stem elongation. Nitrogen re-mobilization from the vegetative parts of the plant contributes significantly to the nitrogen in the grain. Practically speaking this means that you need to have your N available early enough for the plant to take it up into the tissue. When the plant reaches GS 50 (heading) the nitrogen in the leaves will be mobilized to contribute to grain filling.
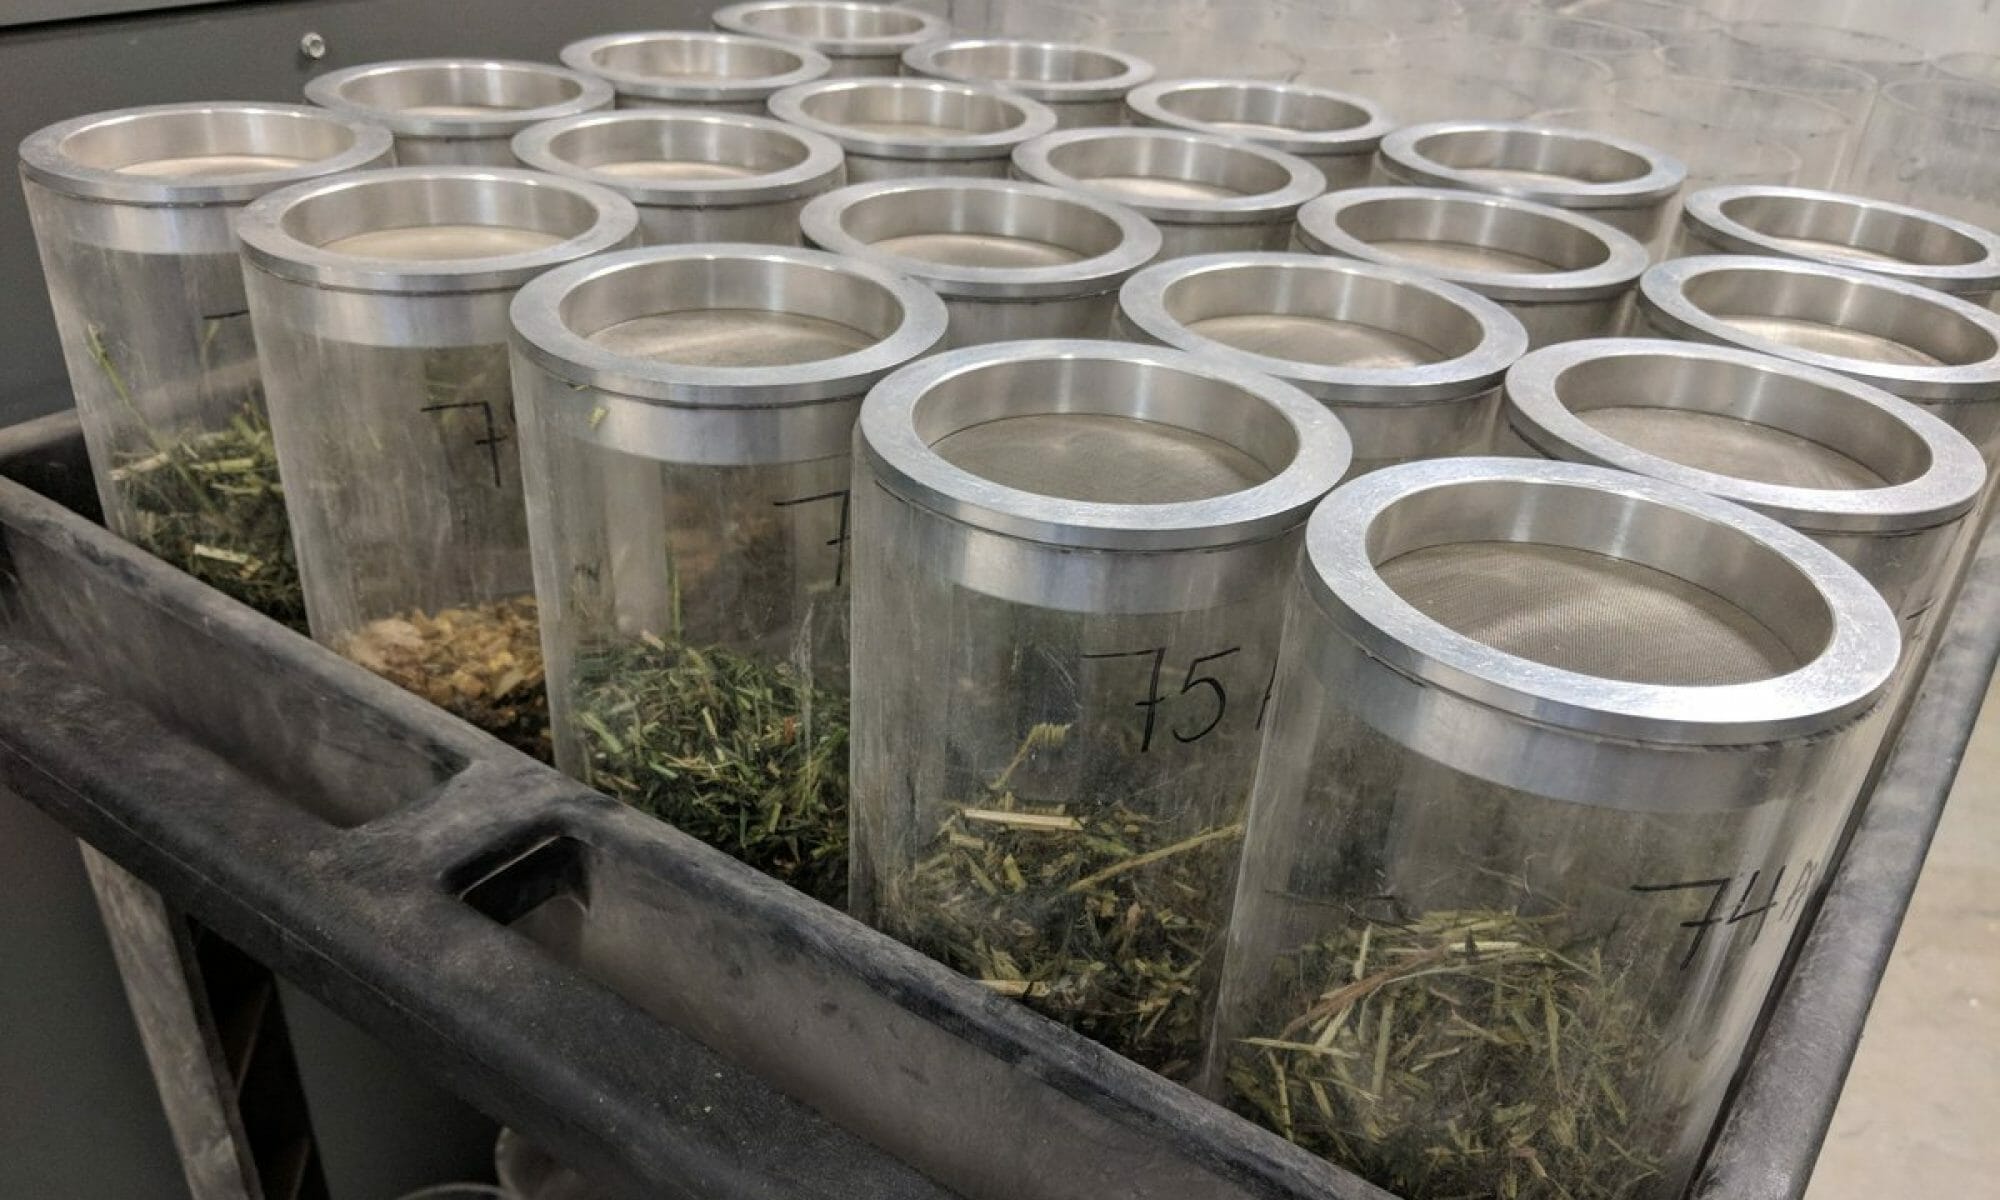
Like everything in nature it is also important to look at the balance of nutrients in the plant. Excess available nitrogen can cause lodging and disease, so understanding soil mineralization, timing, form, and amount are critical factors in proper management. Tissue testing is the best way to determine if you have maximized the amount of nitrogen in the plant to improve the chances of maximum grain fill. It will also allow you to determine imbalances with other nutrients in the plant.
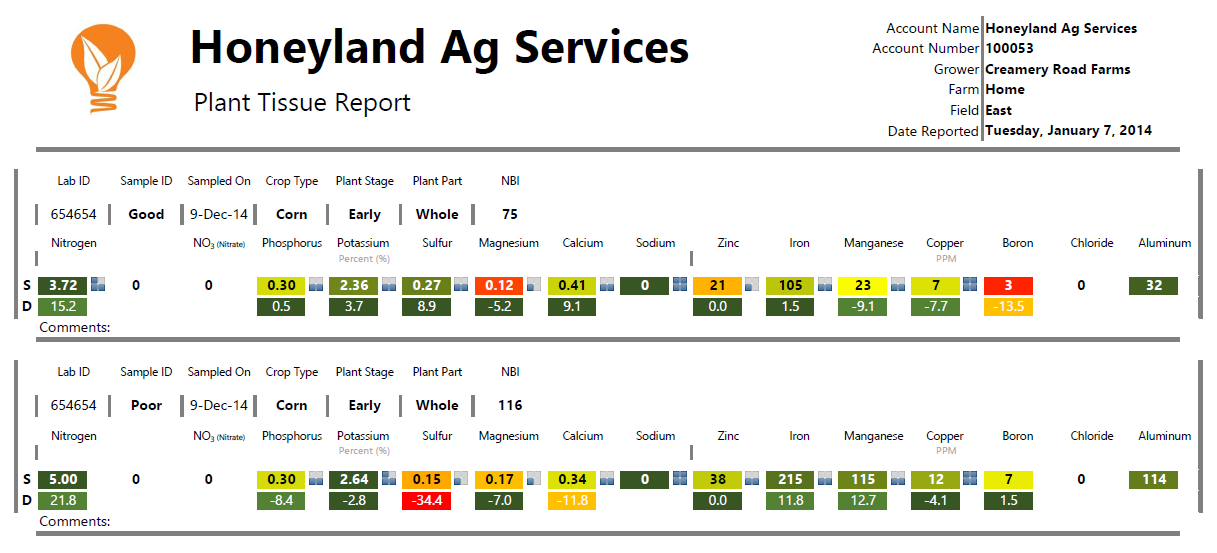
Plant Tissue Report:
To allow you to better understand N levels in plant tissue we are following a few sites. You can view them here: Nitrogen Levels in Winter Wheat
Sources:
Field Facts: Spring Nitrogen Management of Soft Red Winter Wheat, Pioneer Agronomy Library
Nitrogen Management for Winter Wheat:
Principles and Recommendations, Virginia Co-Operative Extension
