The Corn Silage Processing Score was developed by Dr. Dave Mertens at the USDA Forage Research Center as a tool to define adequacy of kernel processing by forage harvesters. In addition, the CSPS is a tool that defines starch particle size and can be used to make inference on ruminal and total tract digestibility of starch in ruminants.
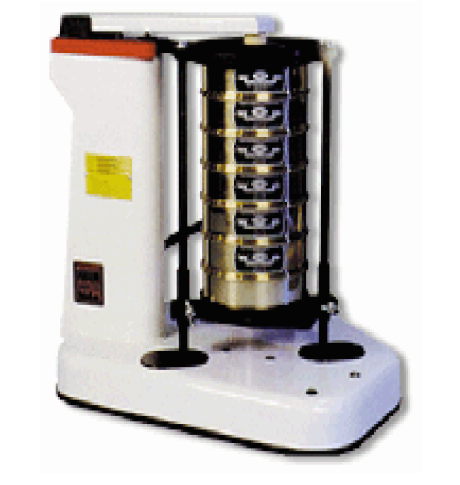
In the Corn Silage Processing Score approximately 600 ml of dried corn silage is sieved in a Ro – Tap Shaker for 10 minutes. This unit oscillates 278 times per minute and “taps” the top of the sieves 150 times per minute to create an aggressive shaking action.
Material that passes through the 4.75 mm sieve screen is collected and analyzed for starch content. The percentage of starch that passes through this screen becomes the “Processing Score”. As part of the same sieving process, the amount of material that passes through the 1.18 mm sieve screen can be evaluated for NDF. This NDF is considered ineffective fiber and is subtracted from the total to determine the percentage of NDF that is effective, or the PeNDF value.
The above data was generated from Cumberland Valley Analytical Services, Inc. analysis of corn silage data from the 2006 crop year. The mean score is 51% on 551corn silage samples evaluated.
Dr. Mertens provides the following interpretation of the CSPS, the percentage of starch passing through the coarse 4.75 mm screen:
- Greater than 70% >>>>>>>>>>>>> Optimally Processed
- Between 50% and 70% >>>>>>>> Adequate Processing
- Less than 50% >>>>>>>>>>>> Inadequately Processed
Based on this scale, almost half of the corn silages are inadequately processed.
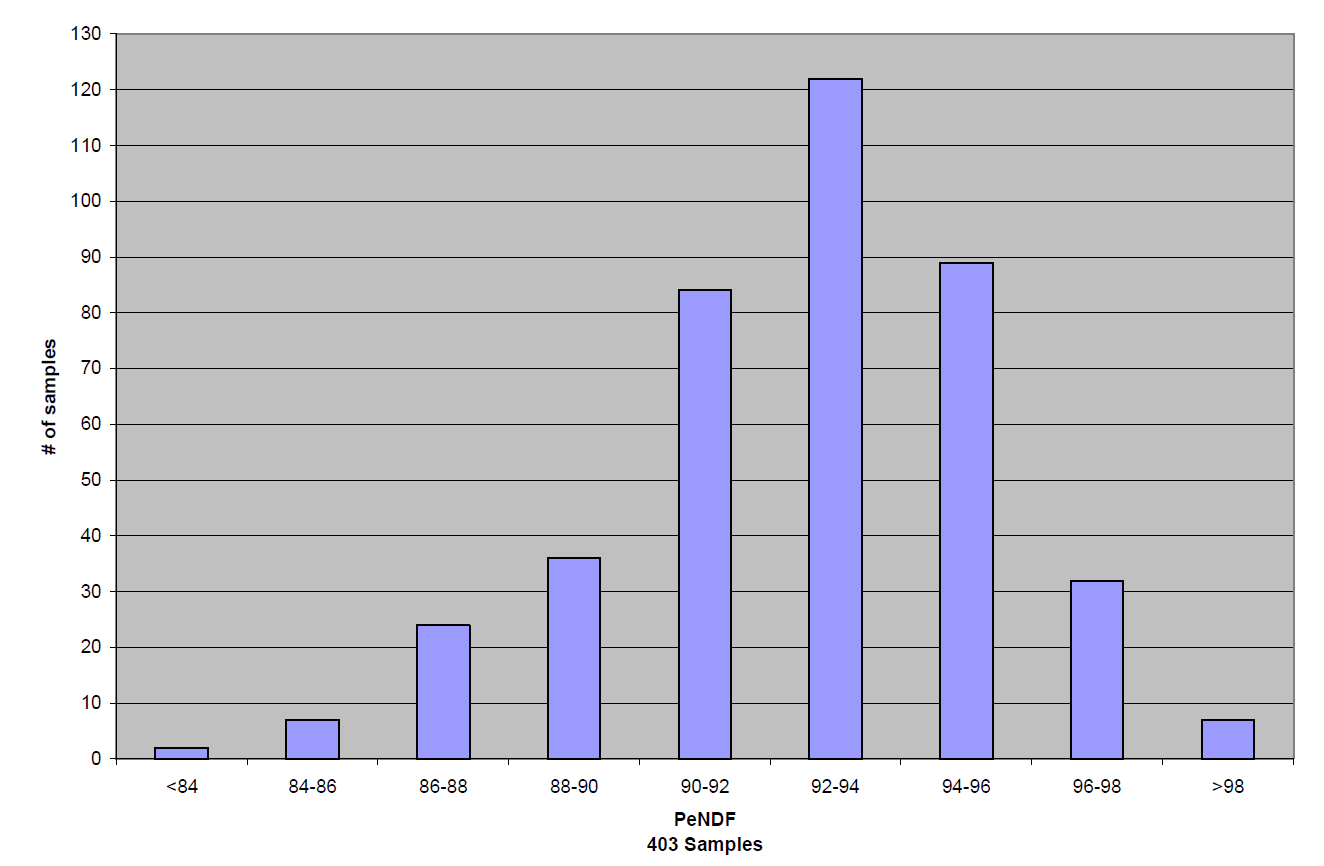
The sieving technique that allows for development of the Corn Silage Processing Score will generate a Physically Effective NDF Value (PeNDF). In this evaluation the amount of NDF that does not pass through a sieve with a 1.15 mm opening is considered “effective”.
Below is the distribution of 394 PeNDF observations performed on 2006 crop year corn silage by CVAS. Ninety percent of values fell between 89% and 98%, this being the percentage of total NDF that is considered effective. It can be seen that there is a relatively small range in corn silage PeNDF values. This test may not provide a lot of diagnostic value given the narrow range. The average PeNDF value is 92.6%.
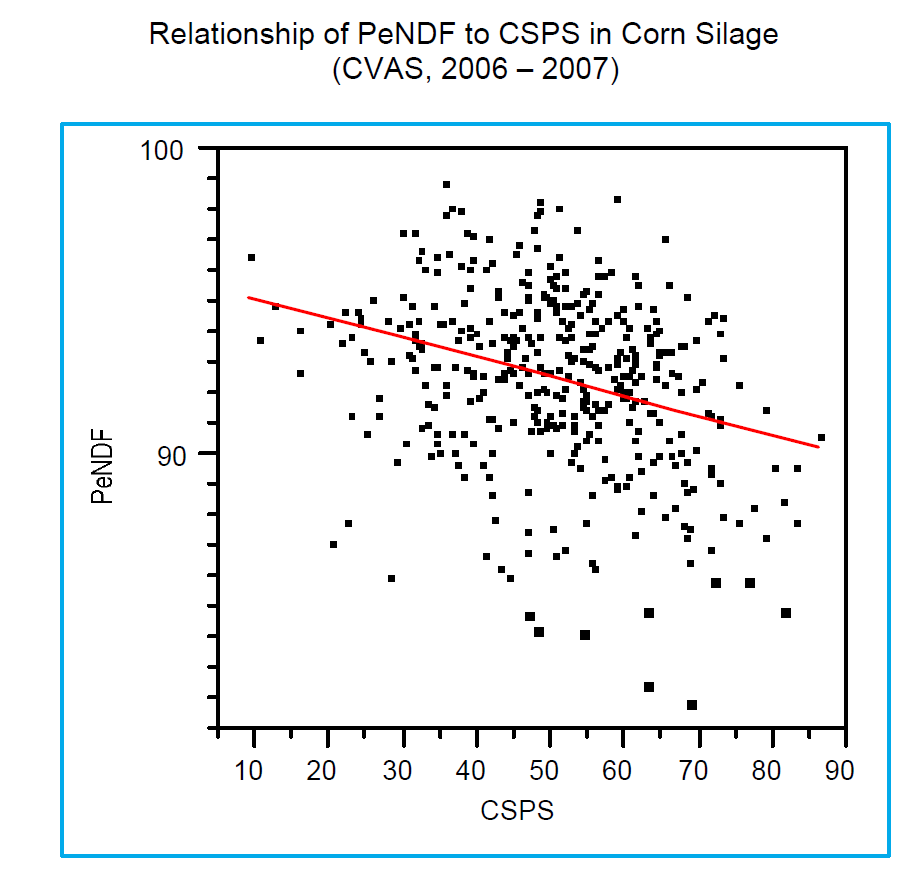
As we consider possible relationship between CSPS and PeNDF we might expect that the better processed corn silage with higher CSPS values will have lower amounts of PeNDF. As we look at the relationship statistically of the two indexes, we find a trend toward lower PeNDF values as CSPS increases. However, this relationship has an R2 of only .09, even though statistically significant. Below is a graph of this relationship:
Ferreira and Mertens in the development of the CSPS found that the percentage of starch greater than 4.75 mm (minimally fragmented) was positively correlated to mean particle size with an (r=.46) but with a low correlation due to different degrees of fragmentation within the same chop length.
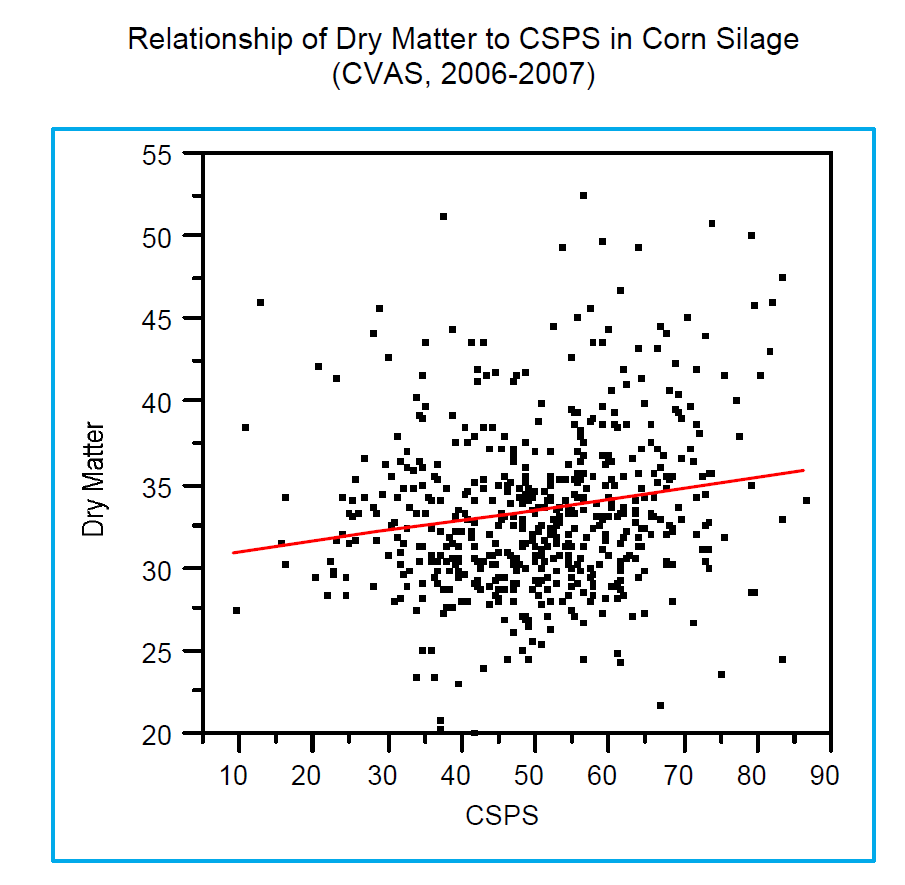
One might expect some influence of dry matter on the friability of the grain in corn silage. As measured by the CSPS, we find no relationship. The amount of variation explained by dry matter differences is only 3%. Below is a graph of this relationship:
Use of CSPS in Milk2006
Milk2006 uses estimates of starch degradability to impact the estimate of TDN and NEl of a corn silage. The CSPS in this model is used to define the use of one of three estimates of starch degradability:
CSPS > 69 (Optimum processing):
Digestible starch % = ((121.59 + (-0.8755 * DM))/100) * 1.08) (from 86% to 98%)
CSPS > 69 (Adequate processing):
Digestible starch % = ((133.20 + (-1.2731 * DM))/100) * 1.08) (from 81% to 98%)
CSPS > 69 (Inadequate processing):
Digestible starch % = ((144.81 + (-1.6707 * DM))/100) * 1.08) (from 76% to 98%)
Information from “Corn Silage Processing Score and peNDF” – http://www.foragelab.com/Media/Corn-Silage-Processing-Score-peNDF.pdf