by Ralph T. Ward and Mary Beth De Ondarza. Taken From Hoards Dairyman
Ward is with Cumberland Valley Analytical Services, Inc., Hagerstown, Md. de Ondarza has a
dairy nutrition consulting business, Paradox Nutrition, LLC, in Plattsburgh, N.Y.
Some people argue that, while fermentation analysis is interesting, it is of little value, providing no information that can be used directly for ration balancing. While it generally is true that the fermentation data have little direct application, this challenge avoids the true value of the analysis.
The fermentation report is meant to provide a comparative evaluation that helps to better characterize silages and give insight into possible intake and performance problems. For example, a silage at 30 percent dry matter that has 1.5 percent butyric acid and 18 percent ammonia nitrogen as a percentage of total nitrogen will be consumed and used differently than a silage at the same dry matter that has no butyric acid and 9 percent ammonia nitrogen. The extent of a poor fermentation can be better determined by a fermentation analysis than by your nutritionist’s eyes and nose.
Your report card . . .
A fermentation profile also is a “report card” on how you handle the silage making process. The fermentation end-products are a summary of all conditions that affected your silage making, including plant maturity, plant moisture, sugar content, the activity of bacteria that were on the plant when it was harvested, additive use, ambient temperature, packing, and bunk face management. Problems with silage making will show up as silage with a poor fermentation profile.
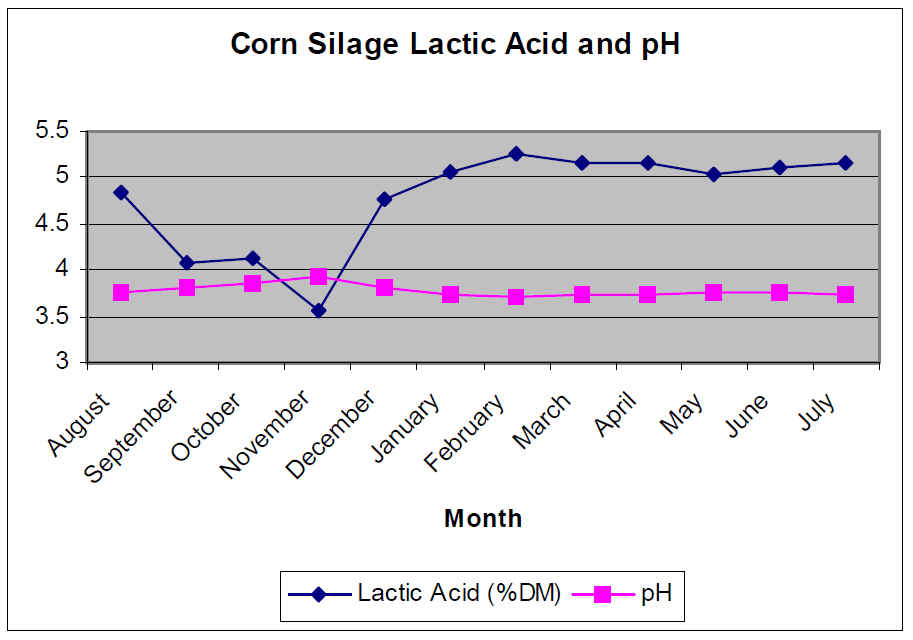
The number one goal of silage making is to reduce oxygen and raise acidity rapidly. By two to three days after ensiling, cell juices are available as a food source for silage bacteria, oxygen should be eliminated, and silage pH should have declined to a level at which the lactic acid bacteria can grow (5.5 to 5.7). The lactic acid bacteria begin to grow, multiply, make lactic acid and some acetic acid, and raise silage acidity more. After about two weeks, silage should reach a final low pH (4.3 to 4.5 in legume silage and 3.8 to 4.0 in corn silage).
Forage that is ensiled properly has a rapid pH drop, and lactic acid should be a significant end-product. Fermentations that yield more lactic acid typically result in the lowest dry matter losses. Silages that have high levels of acetic, propionic, butyric, or iso-butyric suggest poor dry matter recovery.
Generally, in well-preserved silage, at least 65 to 70 percent of the total acid will be lactic acid or 3 to 6 percent lactic acid (dry matter). Acceptable silages generally contain less than 2 percent acetic acid, less than 0.1 percent butyric acid, and less than 1 percent propionic acid.
High levels of silage acids indicate that an extensive fermentation occurred in the silo. Many feeding situations utilize silages with high acid content with no apparent problems. Silage acids are neutralized by the cow’s own saliva or by supplementary buffers in the ration. Increasing the lactic acid content of silage adds to the loading of lactic acid in the rumen, but little of this acid probably accumulates because it is degraded by the rumen lactate-utilizing bacteria and transformed into volatile fatty acids.
Wet silages that have undergone a long fermentation sometimes contain higher levels of acetic acid (greater than 3 percent dry matter). Ammoniated silages also often have higher levels of acetic acid because of their longer fermentation. Acetic acid smells like vinegar. Some acetic acid in silage is helpful for reducing heating of silage after it is fed out. Very high levels of acetic acid (greater than 5 percent) have been suggested to cause intake problems.
Propionic acid levels typically are very low in silages (less than 0.15 percent dry matter), but adding propionic acid as a silage preservative (2 to 4 pounds per ton) raises propionic acid levels up slightly (0.15 to 0.30 percent). Propionic acid has a sharp sweet smell and taste. Haycrop silages ensiled at less than 32 percent dry matter have a greater risk for clostridial growth. Clostridia bacteria are one of the most common undesirable bacteria that may persist in unstable silage that has no oxygen. They produce butyric acid and break down protein. Butyric acid smells like rancid butter.
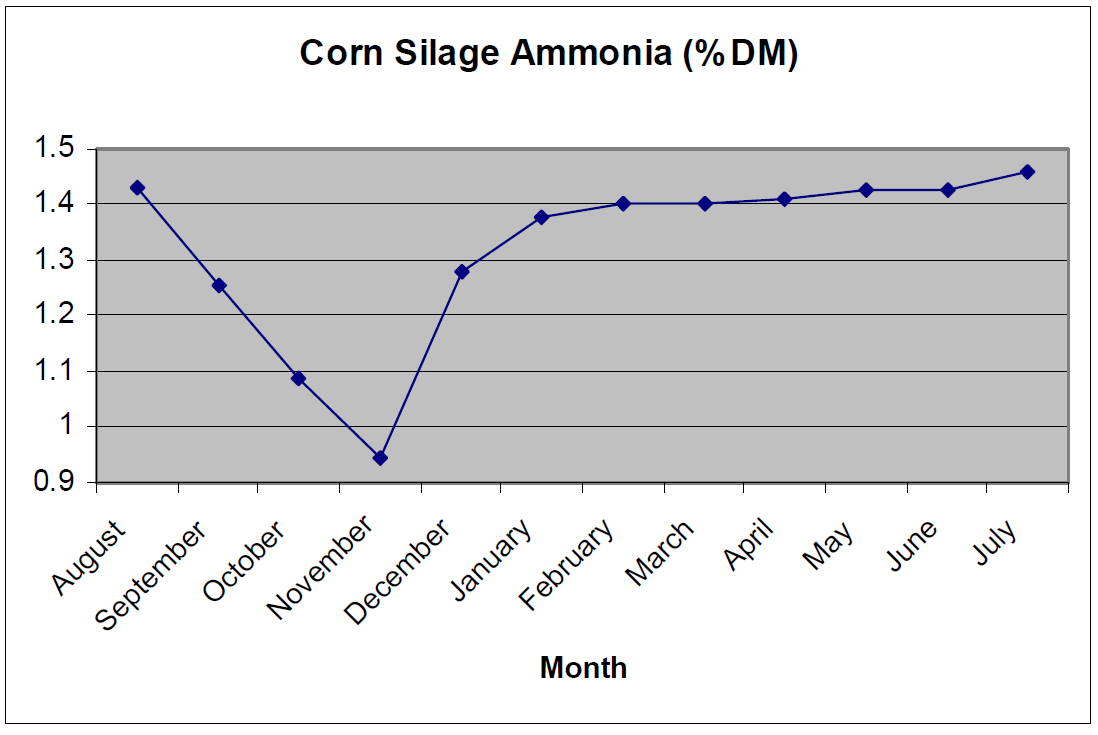
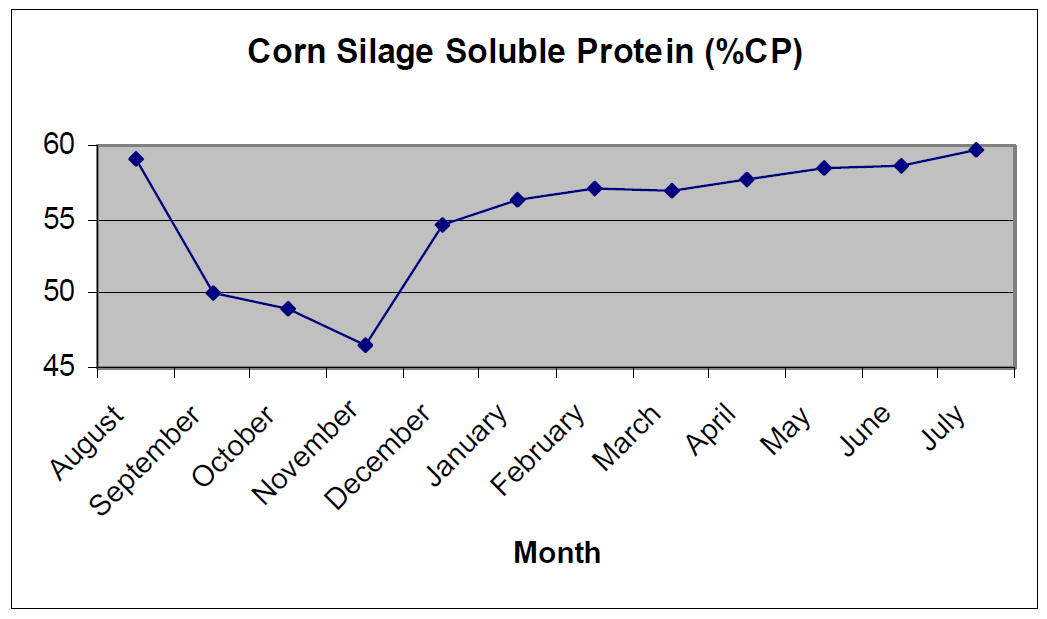
Clostridia usually are associated with silage that has a pH of 5.0 to 5.5. With clostridia, there will be higher silage dry matter losses, poor silage palatability, and a higher level of ammonia nitrogen. It is suspected that the protein breakdown products, such as ammonia, amines, and amides, may be responsible for limiting intake.
A clostridial fermentation problem can be defined as one where butyric acid is greater than
0.25 percent of dry matter. Cumberland Valley Analytical Services, Inc., data indicates that, below 32 percent dry matter, there is a probability of 55 percent or less that a fermentation success would be observed. Above 32 percent dry matter, the probability of success jumps to 74 percent or more. Conditions that determine whether clostridial activity occurs include the dry matter of the crop, buffering capacity, and water-soluble carbohydrate level. Legumes can be put up under wetter conditions successfully if the water-soluble carbohydrate level is high and other conditions necessary for good fermentation are met.
Forages that are ensiled too dry (greater than 50 percent dry matter) or ensiled during cold weather often have a restricted fermentation. This type of silage with its limited amount of fermentation acids often is unstable, has higher dry matter losses, and is more likely to undergo secondary heating. Yeasts are responsible for much of the secondary heating of silages exposed to air and associated dry matter losses. Yeasts convert sugar to alcohol, raising silage pH. Yeast end products, such as ethanol, methyl acetates, and ethyl acetates may limit dry matter intake. Good silages typically have ethanol concentrations less than 1 to 2 percent dry matter.
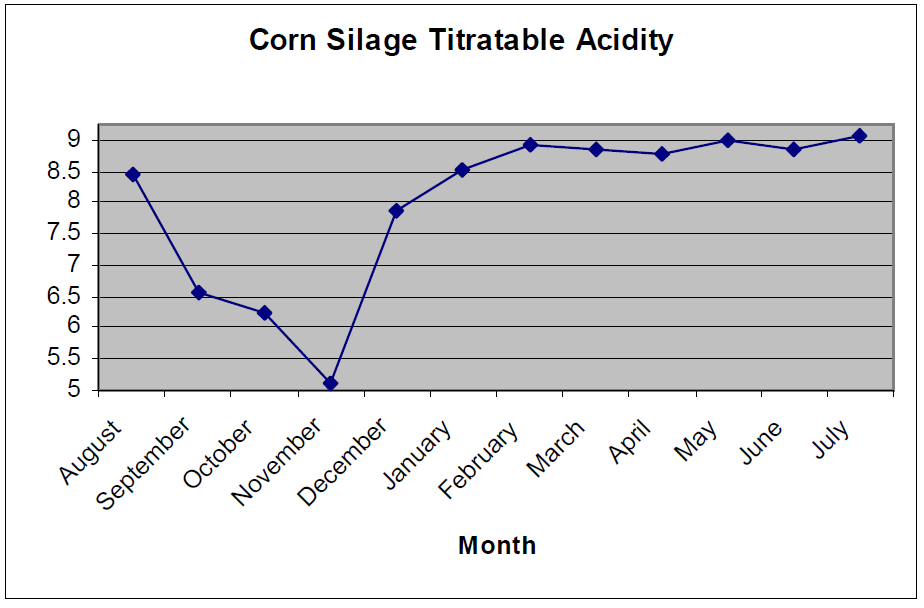
Traditionally, pH has been used to evaluate the quality of fermentation. It is a fast and inexpensive test to run and can be run at the farm easily. While pH in a broad sense can aid in differentiating between a good and poor fermentation, it is limited in the information that it can provide. Two different silages can have the same pH but different concentrations of acids. Comparing total acid levels of silages may be more helpful.
Titratable acidity accounts for the strength of the acids present in a silage. Titratable acidity is highly correlated with total acid levels in corn silage and high-moisture corn but not as highly correlated with total acid levels in legumes because of their greater buffering capacity. In evaluating any given fermentation analysis, it is important to compare it to standard goals for stable silage as well as to compare it to sample averages for similar dry matter levels. (See tables.)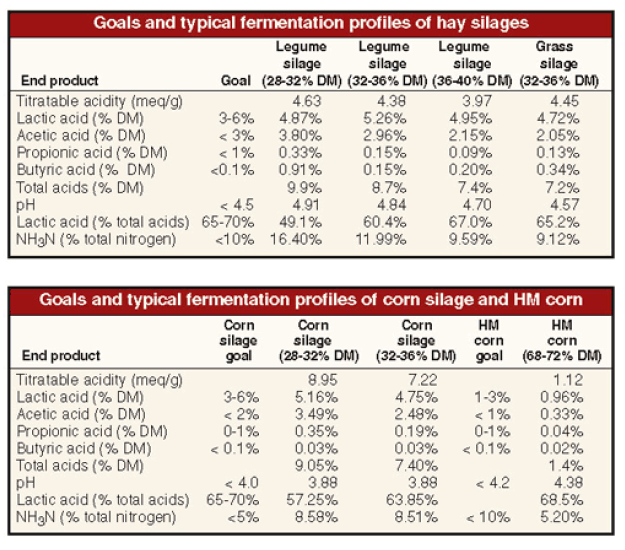
Information from “What Fermentation Analysis Can Tell Us” – http://www.hoards.com/E_crops/cf1
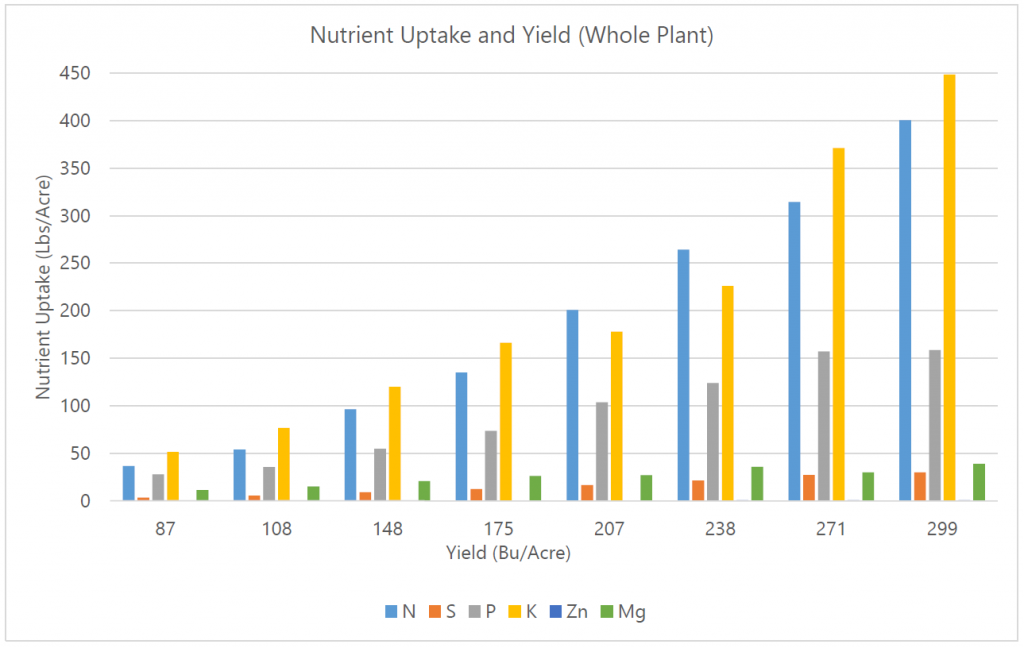 Research from Tony Vyn shows that if yield increases by 3X (108 to 299 bu/acre) you remove 8X N, 9X K, and 10X S from the ground.
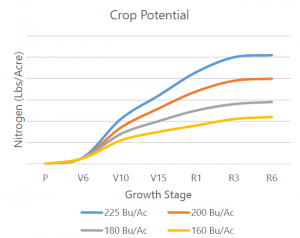 Crop potential can be established in the mid