Is Corn Silage Stable after 3 Weeks of Fermentation

Ralph Ward, Cumberland Valley Analytical Services, Inc.

Mary Beth de Ondarza, Paradox Nutrition, LLC

November 12, 2007

A major goal of corn silage making is to reduce oxygen and increase acidity rapidly so that lactic acid bacteria grow to stabilize and preserve or “pickle” the silage. Often, producers and nutritionists believe that corn silage is fairly well fermented after three weeks of fermentation and it is O.K. to start feeding it. We analyzed a set of corn silage fermentation profile data from New York which was between 26 and 38% DM. We looked at how the fermentation profiles varied according to the month of the year that the samples were sent to CVAS.

Here’s what we found:

 CS Lactic Acid and pH

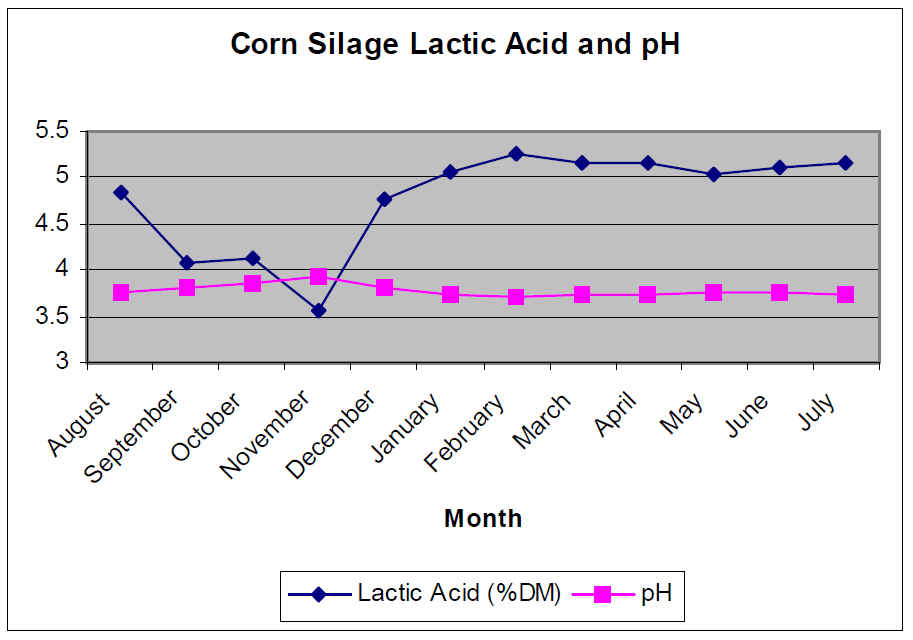
There was significantly (P<0.05) less lactic acid in corn silage analyzed at CVAS in September, October, and November. Lactic acid is a significant end-product of good corn silage fermentations. Higher levels indicate that the corn silage is stable.

Higher pH levels mean less acidity. pH was significantly(P<0.05) higher in September, October, November, and even December .

CS Titratable Acidity

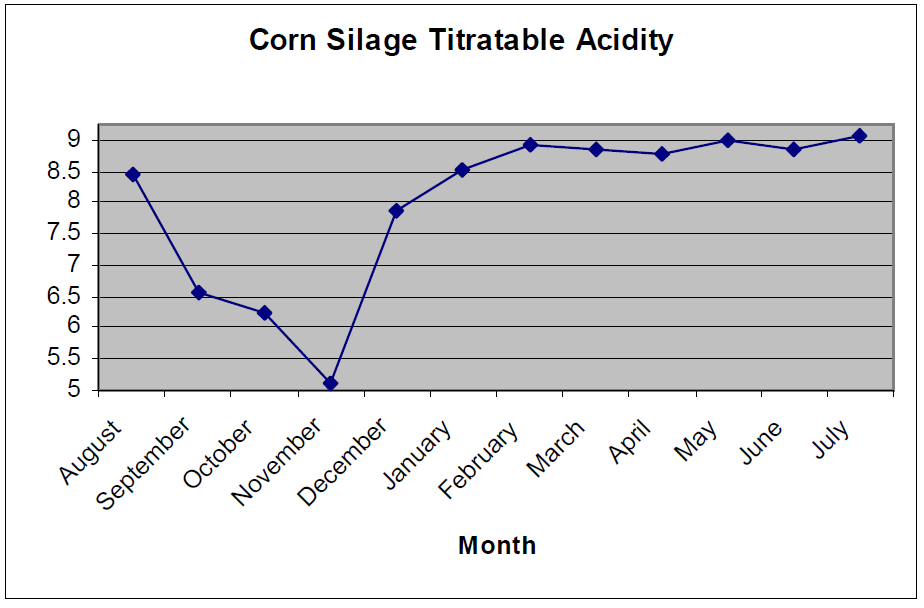
Titratable Acidity (meq/g) was significantly (P<0.05) less in samples analyzed in September, October, November, and December than in samples analyzed from January to July.

Titratable acidity accounts for the strength of acids present in the corn silage and is highly correlated with total acid levels in corn silage.

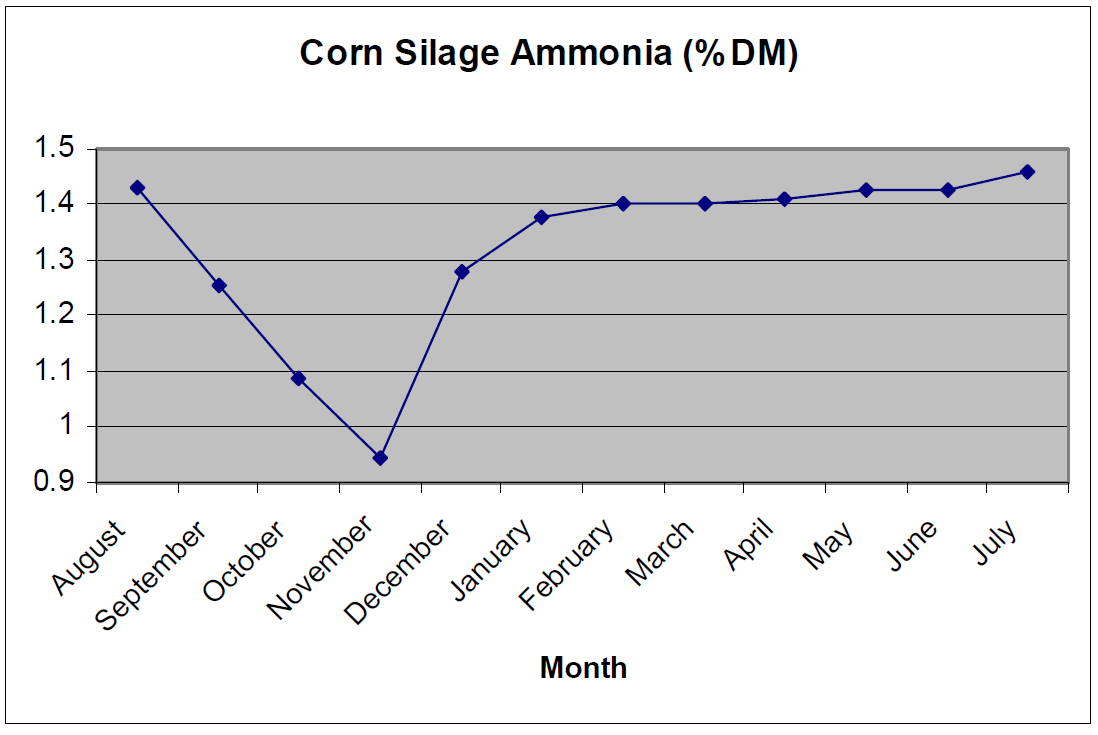
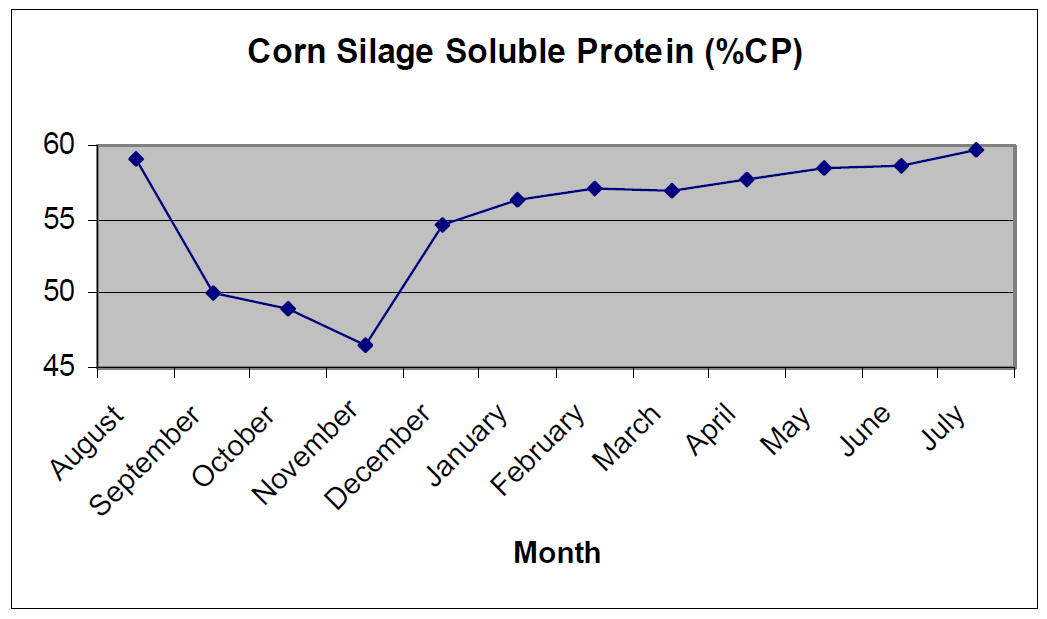
Although we don’t want extensive protein degradation in our corn silages, the level of ammonia and the level of soluble protein will continue to increase until the fermentation has stabilized. Both ammonia and soluble protein levels were significantly (P<0.05) lower in samples of corn silage sent to CVAS in September, October, November, and December than from February to August. This indicates that those corn silage samples sent in the fall had not fully fermented.

CS AmmoniaCS Soluble Protein

Most nutritionists and producers would agree that cows milk best on fully fermented corn silage. Our data indicate that most corn silage will not be fully fermented until it has fermented for about four months.


Information from “Is Corn Silage Stable after 3 Weeks of Fermentation” – http://www.foragelab.com/Media/Is-Corn-Silage-Stable-After-3-Weeks-Fermentation.pdf

Corn Silage Processing Score and peNDF

The Corn Silage Processing Score was developed by Dr. Dave Mertens at the USDA Forage Research Center as a tool to define adequacy of kernel processing by forage harvesters. In addition, the CSPS is a tool that defines starch particle size and can be used to make inference on ruminal and total tract digestibility of starch in ruminants.

In the Corn Silage Processing Score approximately 600 ml of dried corn silage is sieved in a Ro – Tap Shaker for 10 minutes. This unit oscillates 278 times per minute and “taps” the top of the sieves 150 times per minute to create an aggressive shaking action.

Material that passes through the 4.75 mm sieve screen is collected and analyzed for starch content. The percentage of starch that passes through this screen becomes the “Processing Score”. As part of the same sieving process, the amount of material that passes through the 1.18 mm sieve screen can be evaluated for NDF. This NDF is considered ineffective fiber and is subtracted from the total to determine the percentage of NDF that is effective, or the PeNDF value.

RotapCSPS 2006

The above data was generated from Cumberland Valley Analytical Services, Inc. analysis of corn silage data from the 2006 crop year. The mean score is 51% on 551corn silage samples evaluated.

Dr. Mertens provides the following interpretation of the CSPS, the percentage of starch passing through the coarse 4.75 mm screen:

  • Greater than 70% >>>>>>>>>>>>> Optimally Processed
  • Between 50% and 70% >>>>>>>> Adequate Processing
  • Less than 50% >>>>>>>>>>>> Inadequately Processed

Based on this scale, almost half of the corn silages are inadequately processed.

The sieving technique that allows for development of the Corn Silage Processing Score will generate a Physically Effective NDF Value (PeNDF). In this evaluation the amount of NDF that does not pass through a sieve with a 1.15 mm opening is considered “effective”.

Below is the distribution of 394 PeNDF observations performed on 2006 crop year corn silage by CVAS. Ninety percent of values fell between 89% and 98%, this being the percentage of total NDF that is considered effective. It can be seen that there is a relatively small range in corn silage PeNDF values. This test may not provide a lot of diagnostic value given the narrow range. The average PeNDF value is 92.6%.

peNDF

As we consider possible relationship between CSPS and PeNDF we might expect that the better processed corn silage with higher CSPS values will have lower amounts of PeNDF. As we look at the relationship statistically of the two indexes, we find a trend toward lower PeNDF values as CSPS increases. However, this relationship has an R2 of only .09, even though statistically significant. Below is a graph of this relationship:

peNDF CSPS Relationship

Ferreira and Mertens in the development of the CSPS found that the percentage of starch greater than 4.75 mm (minimally fragmented) was positively correlated to mean particle size with an (r=.46) but with a low correlation due to different degrees of fragmentation within the same chop length.

One might expect some influence of dry matter on the friability of the grain in corn silage. As measured by the CSPS, we find no relationship. The amount of variation explained by dry matter differences is only 3%. Below is a graph of this relationship:

Dry Matter CSPS Relationship

Use of CSPS in Milk2006

Milk2006 uses estimates of starch degradability to impact the estimate of TDN and NEl of a corn silage. The CSPS in this model is used to define the use of one of three estimates of starch degradability:

CSPS > 69 (Optimum processing):

Digestible starch % = ((121.59 + (-0.8755 * DM))/100) * 1.08) (from 86% to 98%)

CSPS > 69 (Adequate processing):

Digestible starch % = ((133.20 + (-1.2731 * DM))/100) * 1.08) (from 81% to 98%)

CSPS > 69 (Inadequate processing):

Digestible starch % = ((144.81 + (-1.6707 * DM))/100) * 1.08) (from 76% to 98%)


Information from “Corn Silage Processing Score and peNDF”  – http://www.foragelab.com/Media/Corn-Silage-Processing-Score-peNDF.pdf

Staygreen Nitrogen Management Program

In order to better manage corn nitrogen levels through the growing season we need to measure it. Nitrogen levels fluctuate during the growing season. This fluctuation is related to many different factors that can influence nitrogen mineralization and/or application.

Soil Nitrate and Crop Uptake Chart

We are measuring to have better insight about how much N we have going into the crop year, how well we manage nutrients through the growing season and if we have any N left over at the end.


How it works:

Step 1: Pick a spot. This spot should be representative of the most common management zone in the field.

Step 2: Call us to activate your location.

Step 3: We take care of the rest!


Sampling Regime

Timing

Soil Nitrate Test (Depths)

Plant Tissue Test

Corn Stalk Nitrate Test

Pre-Plant

1

V6

2

1

V12

2

1

Tasseling

2

1

Harvest

1

1

What do I receive?

  • 8 Soil Nitrate tests (1 or 2 depths depending on the time in the season) to monitor the nitrate through the season.
  • 3 Plant Tissue tests to see look at nutrient balance.
  • 1 Corn Stalk Nitrate Test to determine if the nitrogen program was deficient, adequate or excessive.
  • Your data (Soil, Plant Tissue, Corn Stalk) benchmarked against the average of all sites for that time period. This allows you to compare to other fields. You will also receive all of your data in an excel file at the end of the year with the average data.
  • Our Staygreen Insight newsletter, included with every new round of data, which will feature data and observations from the growing season.

 Example Soil Nitrate Report:

Soil Nitrate and Crop Uptake Chart 2


Cost Per Site:

$350 (within 40 km of Honeyland Ag Services) – Additional charges may apply, please contact us for details.

For a PDF version please click here: Honeyland Staygreen Program Details