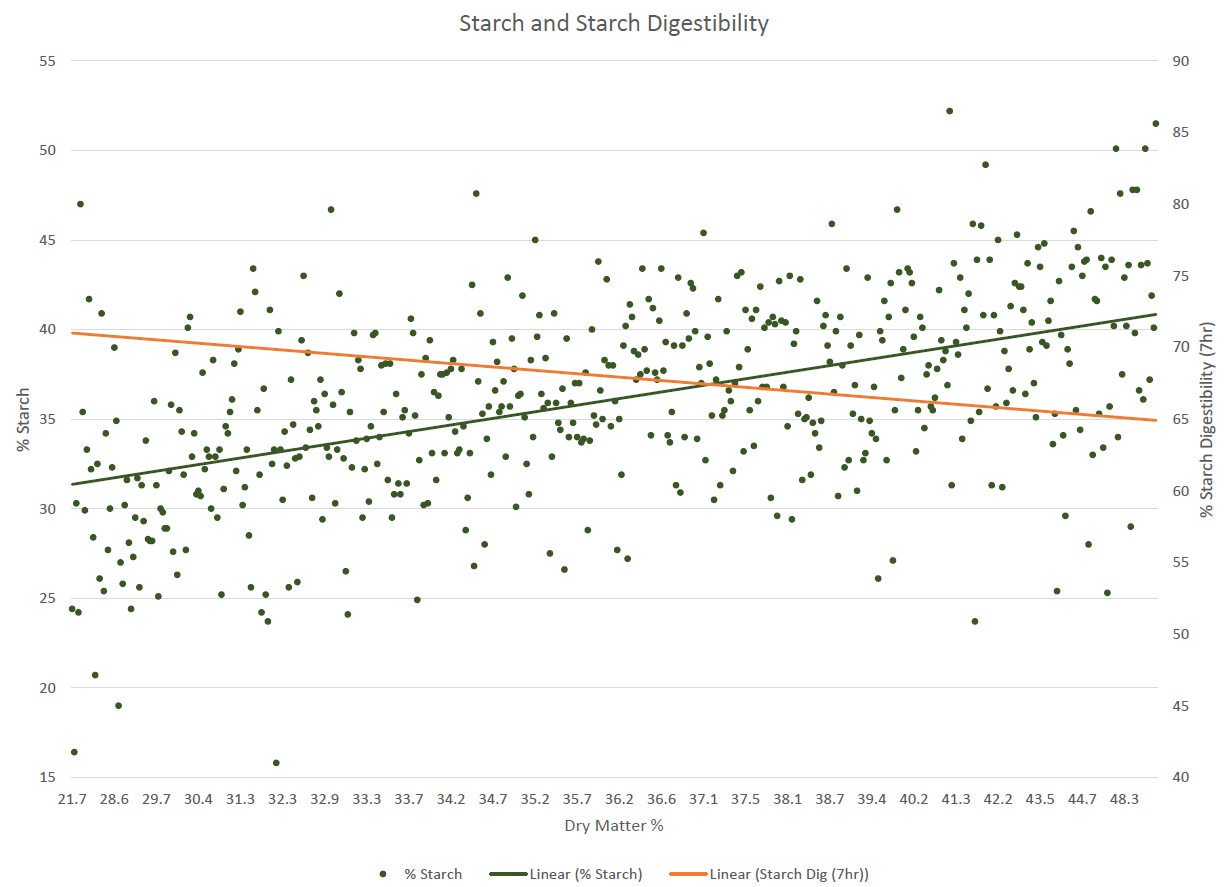
The chart above shows us the trends in 516 corn silage samples from this fall. As you would expect the starch content increases with increased dry matter and the opposite is true for starch digestibility which decreases as dry matter increases. Although there is a trend it is also interesting to see the large variance in starch content at any given moisture level. The variance of starch within moisture levels would likely be explained by crop management and genetics.
January Corn Silage Processing Score (CSPS) Promotion
The Corn Silage Processing Score has been called one of the most under utilized tests in forage analysis. This has changed recently with more nutritionists using the CSPS than previous years. In order to improve turn around time and better serve our customers we have recently acquired a Rotap shaker.
Past testing in Ontario indicates that only 29% of corn silage is optimally processed! You can see the data here
For the Month of January, we are offering a free CSPS on any sample submitted for an NIR package with the “plus” option.
An added benefit of sampling/re-sampling in January is that you can re-evaluate starch digestibility. After harvest starch digestibility improves on average 8% in the first three weeks of fermentation and another 8% by January.
Ralph Ward, Cumberland Valley Analytical Services, Inc.
Mary Beth de Ondarza, Paradox Nutrition, LLC
November 12, 2007
A major goal of corn silage making is to reduce oxygen and increase acidity rapidly so that lactic acid bacteria grow to stabilize and preserve or “pickle” the silage. Often, producers and nutritionists believe that corn silage is fairly well fermented after three weeks of fermentation and it is O.K. to start feeding it. We analyzed a set of corn silage fermentation profile data from New York which was between 26 and 38% DM. We looked at how the fermentation profiles varied according to the month of the year that the samples were sent to CVAS.
Here’s what we found:
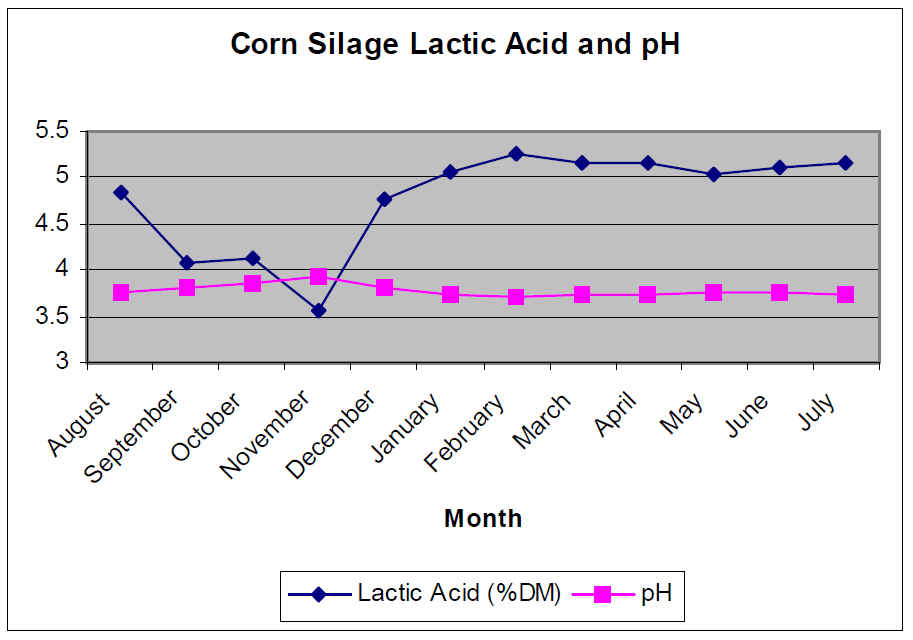
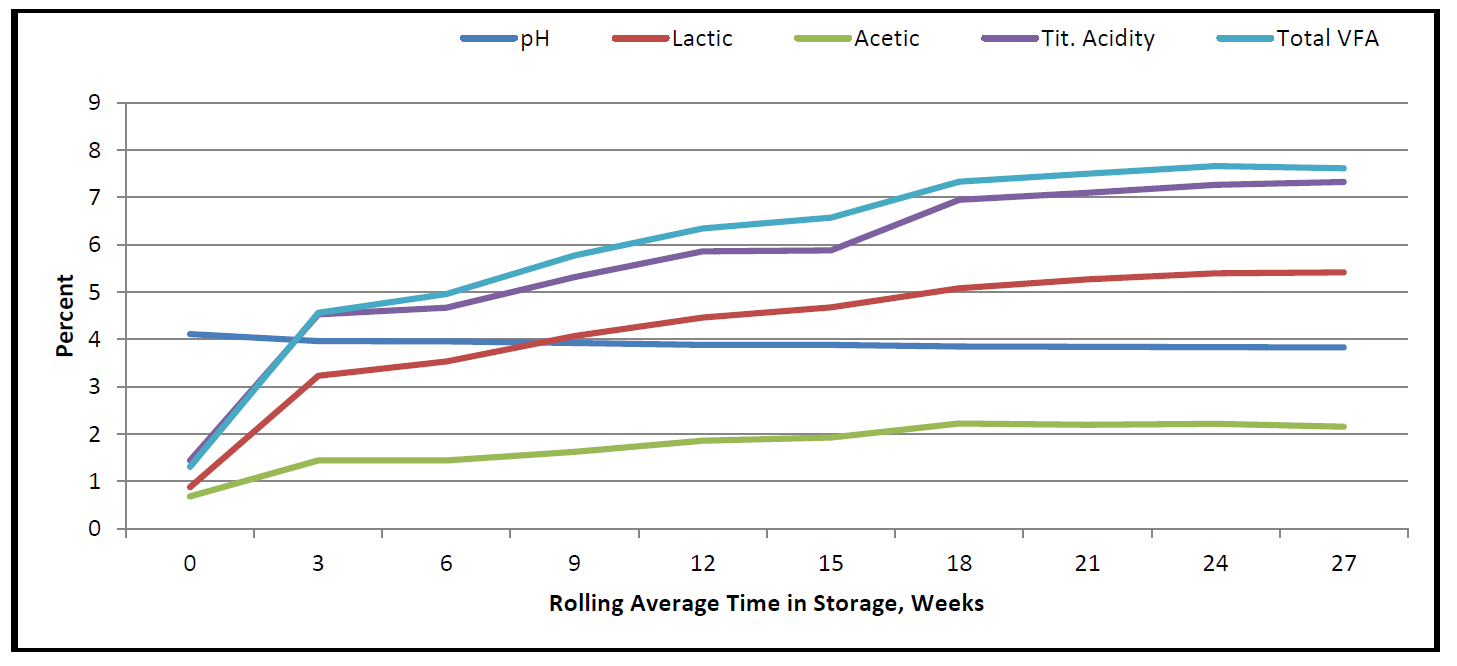
There was significantly (P<0.05) less lactic acid in corn silage analyzed at CVAS in September, October, and November. Lactic acid is a significant end-product of good corn silage fermentations. Higher levels indicate that the corn silage is stable.
Higher pH levels mean less acidity. pH was significantly(P<0.05) higher in September, October, November, and even December .
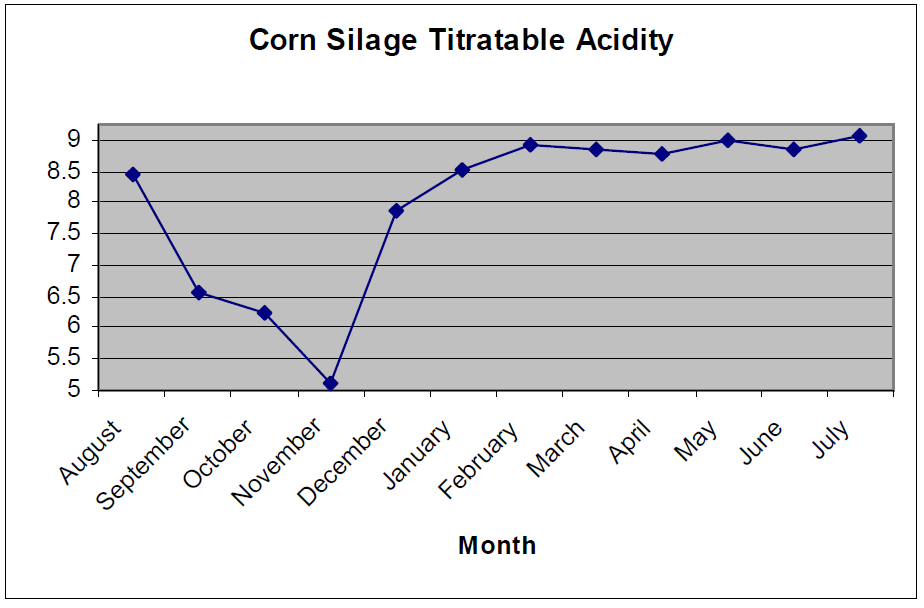
Titratable Acidity (meq/g) was significantly (P<0.05) less in samples analyzed in September, October, November, and December than in samples analyzed from January to July.
Titratable acidity accounts for the strength of acids present in the corn silage and is highly correlated with total acid levels in corn silage.
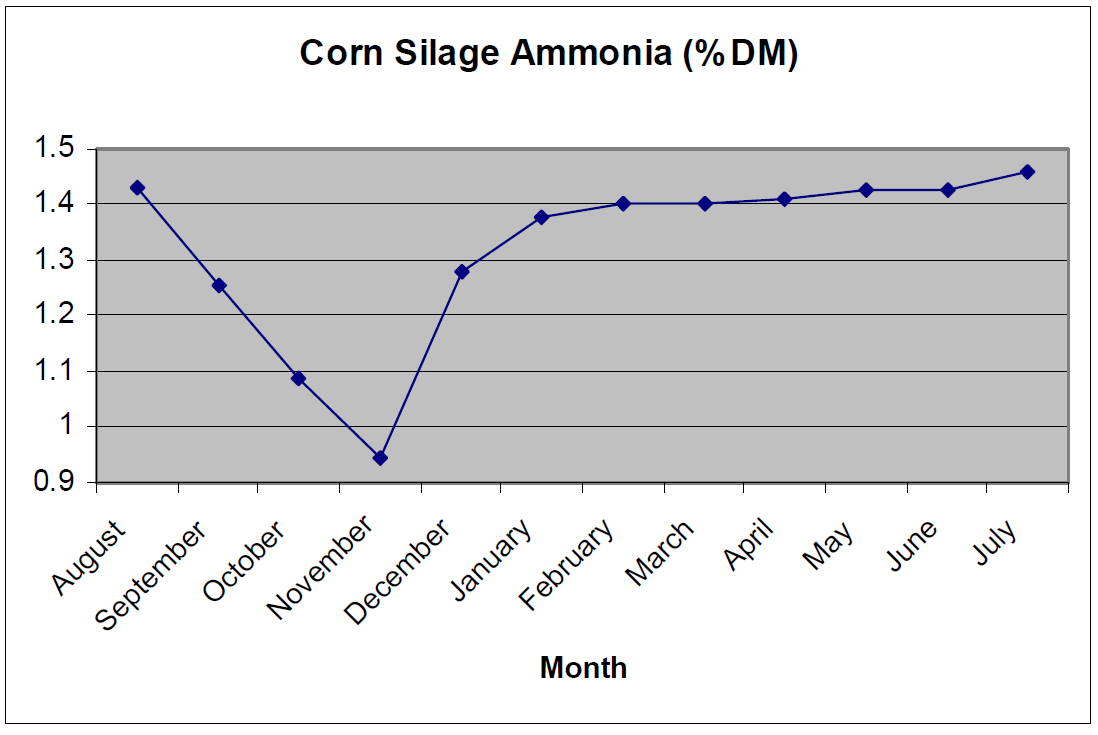
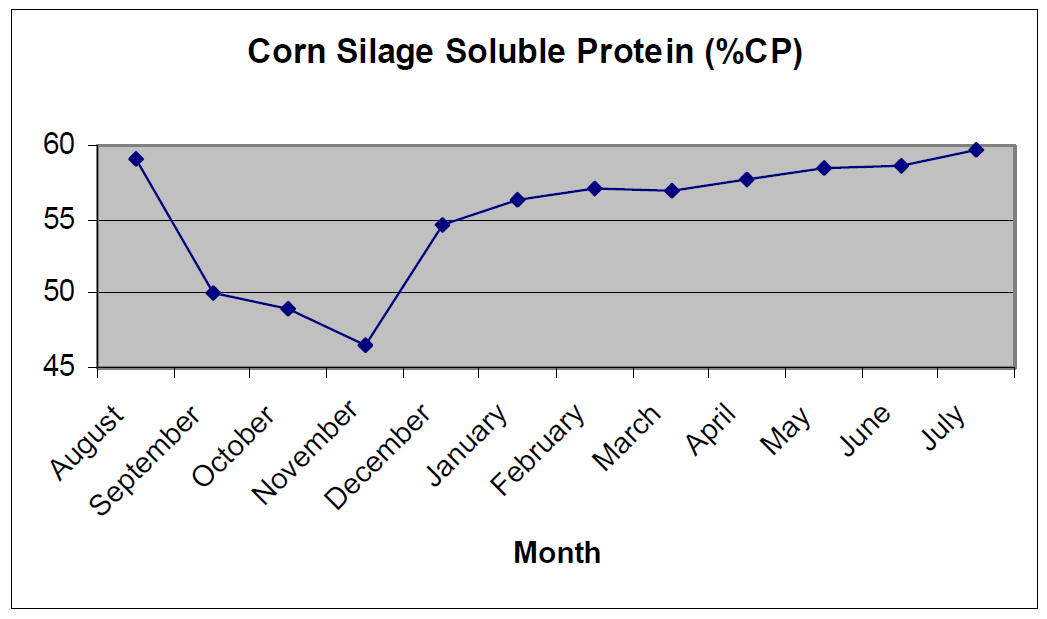
Although we don’t want extensive protein degradation in our corn silages, the level of ammonia and the level of soluble protein will continue to increase until the fermentation has stabilized. Both ammonia and soluble protein levels were significantly (P<0.05) lower in samples of corn silage sent to CVAS in September, October, November, and December than from February to August. This indicates that those corn silage samples sent in the fall had not fully fermented.
Most nutritionists and producers would agree that cows milk best on fully fermented corn silage. Our data indicate that most corn silage will not be fully fermented until it has fermented for about four months.
The 2012 corn silage crop appears to have stabilized after five months in storage for the Northeast and Mid-Atlantic regions. A review of the past month’s data would indicate that there may not be a lot of significant change in nutrient values in stored corn silage from this point on. This does not mean however that some smaller evolution in protein and carbohydrate fractions may not occur.
It was about five years ago that we started reporting based on aggregate lab data that corn silage characteristics changed over the months of storage and never reached a totally stable endpoint . We determined that most of the significant changes occurred over the initial 6 months of storage and then plateaued. However, it may be that the more subtle changes after this point were confounded by the impact of hot weather on materials sampled from a bunker or storage structure face.
Dr. Charlie Sniffen evaluated some of our historic corn silage data several years ago and found that there were surprisingly strong relationships between some of the nutrient characteristics over time. These relationships were consistent with what was being recognized about the impact of time in storage on protein and carbohydrate fractions.
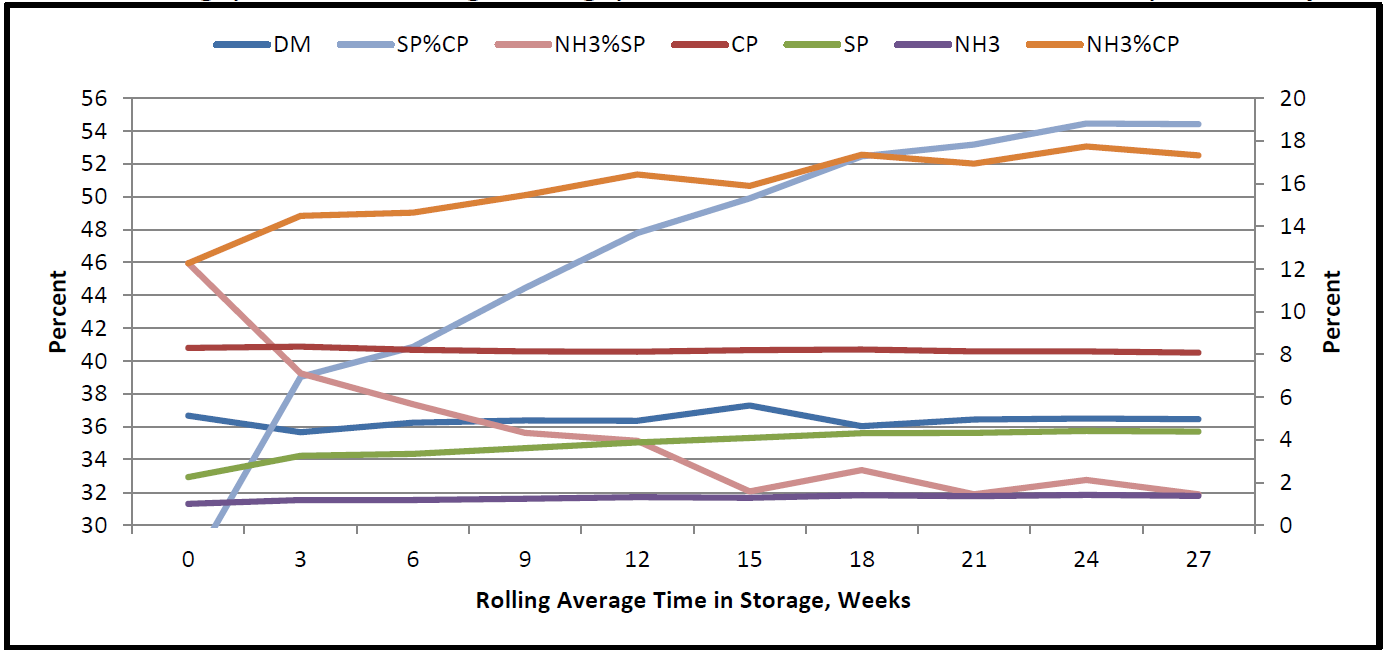
Evaluating the data we determined a likely average fermentation “start point” for corn silage from the Northeast and Mid-Atlantic states. From that point we established a three week rolling average to smooth the data. In the pages that follow is a summary of that information. Each week represents between 500 and 2500 samples. We will continue to update this information through the summer every couple of months.
As our market continues to increase in the upper Midwest we will be able to create a separate “Fermometer” for that region of the country. Visit www.foragelab.com and check our “News and Updates” for a current “Fermometer” reading.
Corn Silage, 3 Week Rolling Average, North-East and Mid-Atlantic Data, 2012 Crop
Storage Week
DM
CP
SP
SP%CP
NH3
NH3%CP
NH3%SP
Sep
0
36.7
8.3
2.3
27.1
1.01
12.3
46.0
22-Sep
3
35.7
8.36
3.26
39.0
1.19
14.5
39.2
13-Oct
6
36.2
8.22
3.35
40.9
1.18
14.6
37.4
3-Nov
9
36.4
8.15
3.61
44.4
1.24
15.5
35.6
24-Nov
12
36.4
8.13
3.89
47.8
1.32
16.4
35.1
15-Dec
15
37.3
8.20
4.09
49.9
1.29
15.9
32.1
5-Jan
18
36.0
8.23
4.31
52.5
1.41
17.4
33.4
26-Jan
21
36.4
8.15
4.33
53.2
1.37
16.9
31.9
16-Feb
24
36.5
8.14
4.42
54.5
1.43
17.7
32.8
9-Mar
27
36.5
8.08
4.39
54.4
1.38
17.3
31.9
Corn Silage, 3 Week Rolling Average, North-East and Mid-Atlantic Data, 2012 Crop
Storage Week
Sugar
Starch
IVSD7
NDF
NDFD30
iNDFD
Sol. Fiber
Sep
0
1.53
37.12
62.56
36.9
59.12
23.92
7.61
22-Sep
3
1.30
33.80
69.89
38.85
61.45
24.65
7.02
13-Oct
6
1.08
35.09
70.57
38.30
61.11
24.93
6.63
3-Nov
9
0.94
35.28
72.42
38.50
60.76
25.61
6.28
24-Nov
12
0.91
34.84
74.41
39.05
60.89
26.13
6.08
15-Dec
15
1.19
33.59
75.72
39.54
59.75
26.67
6.25
5-Jan
18
0.92
34.31
76.88
39.39
60.32
27.39
5.88
26-Jan
21
0.88
34.54
76.32
38.96
60.85
25.83
6.13
16-Feb
24
0.80
35.08
76.63
38.57
60.99
26.04
6.03
9-Mar
27
0.85
35.02
76.58
38.50
61.42
25.49
6.17
Corn Silage, 3 Week Rolling Average, North-East and Mid-Atlantic Data, 2012 Crop
Storage Week
pH
Lactic
Acetic
Tit. Acidity
Total VFA
Sep
0
4.11
0.88
0.68
1.44
1.31
22-Sep
3
3.96
3.23
1.44
4.53
4.57
13-Oct
6
3.96
3.53
1.44
4.67
4.96
3-Nov
9
3.92
4.07
1.63
5.31
5.78
24-Nov
12
3.89
4.47
1.86
5.86
6.34
15-Dec
15
3.88
4.68
1.92
5.88
6.57
5-Jan
18
3.85
5.08
2.23
6.95
7.33
26-Jan
21
3.84
5.27
2.20
7.10
7.50
16-Feb
24
3.84
5.40
2.22
7.27
7.66
9-Mar
27
3.83
5.41
2.16
7.33
7.62
Commentary on Measured Nutrients
SP%CP – Soluble protein as a % of crude protein: This value is low in the un-harvested crop but increases over time as plant enzymes break down proteins to amino acids and peptides and bacteria break these down to release ammonia.. Fresh corn silage will run around 25% and over time this value may increase to over 60% of the protein.
NH3%SP – Ammonia as a % of soluble protein: This value is provided as some of the nutritional models consider this relationship. Ammonia creation is probably a function of initial plant enzyme activity and then of certain bacterial species. It will increase some over time, but not as quickly as peptide breakdown increases soluble protein, so NH3%SP will decline over time.
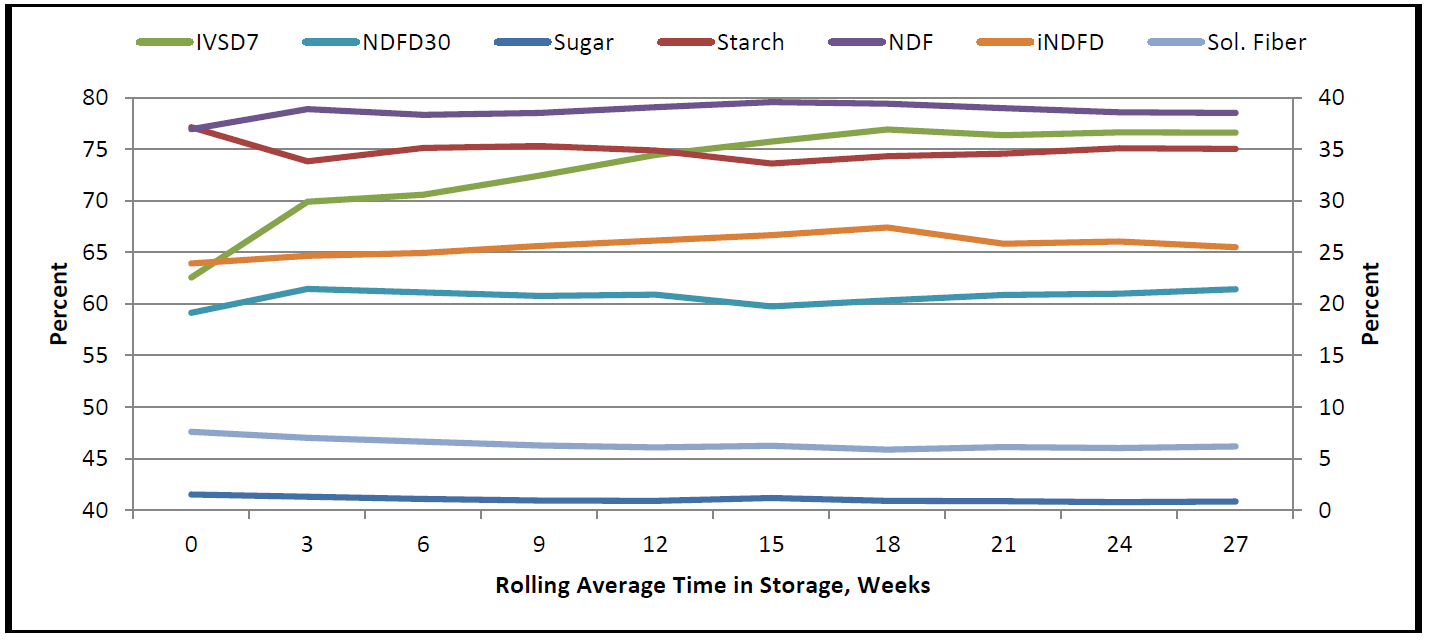
Sugar – This represents ethanol soluble carbohydrate which is primarily residual glucose, sucrose. In the standing plant grown in temperate regions this value at harvest may be as high as 20%, but quickly drops as initial respiration and the microbial action ferments the sugars to acids. In corn silage there is significant sugars to carbon dioxide and water, and microbial action ferments the sugars to acids. In corn silage, sugars quickly drop to below 2%. We expect to see the sugar value quickly drop and stabilize as low pH levels and low sugar levels limit microbial function.
Starch – This nutrient should be relatively stable over time. Some increase may be perceived as the absolute quantity stays constant and total dry matter drops slightly over time through continued fermentation and nutrient conversion. However, the IVSD7 (in vitro starch digestibility at 7hrs incubation) will increase as the protein matrix protecting the starch structure is broken down over time. There is a recognized relationship between increasing levels of ammonia and increasing starch digestibility. The Wisconsin Grain Evaluator system is based in part on this concept.
NDFD30 – The in vitro NDF digestibility at 30hrs incubation actually drops over time. This may be counterintuitive and contrary to what some research has reported. It is not that the NDF is less digestible, but that the quantity of potentially digestible NDF drops relative to indigestible NDF and thus NDF digestibility as a % of NDF drops. Some of what is defined as NDF is labile and is degraded during the initial period of respiration and fermentation. There is often a measurable drop of about 3% NDFD from fresh to fermented silage. This fermentation summary may pick up some of, but not all of that change. Time in fermentation does not appear to impact or increase the degradability of the potentially digestible NDF component of corn silage.
iNDFD – This is the indigestible NDF as a % of total NDF, measured at 240 hours incubation. As this value does not change compared to other components which may be converted through fermentation or enzymatic action, it can serve as a marker for change. Tracking this value over the initial 8 weeks of fermentation of the 2012 crop, we would perceive a 4.5% loss of dry matter through the fermentation process to this point. This does not account for initial fermentation and respiration losses which can be even more significant.
Soluble fiber – This is a “catch-all” of various undefined carbohydrate fractions in the corn silage plant which can include pectins, plant acids, and oligosaccharides. These components see a significant drop over time in fermentation even though the absolute change is not significant.
Lactic, Acetic acid, Total VFA – As fermentation continues, we anticipate lactic acid, acetic acid, and total VFA levels to rise. Lactic acid levels tend to stabilize more quickly than acetic acid which can continue to increase over time, especially in wetter silages. Titratable acidity is a measure of the amount of base (meq/gram) necessary to titrate the silage to a pH of 6.5. Consider this an index of total acid level in the silage which should follow total VFA fairly closely as there is little buffering capacity in corn silage.
Corn Silage, 3 Week Rolling Average, North-East and Mid-Atlantic Data, 2012 Crop